Sleep Training
Personal Project
Project Purpose
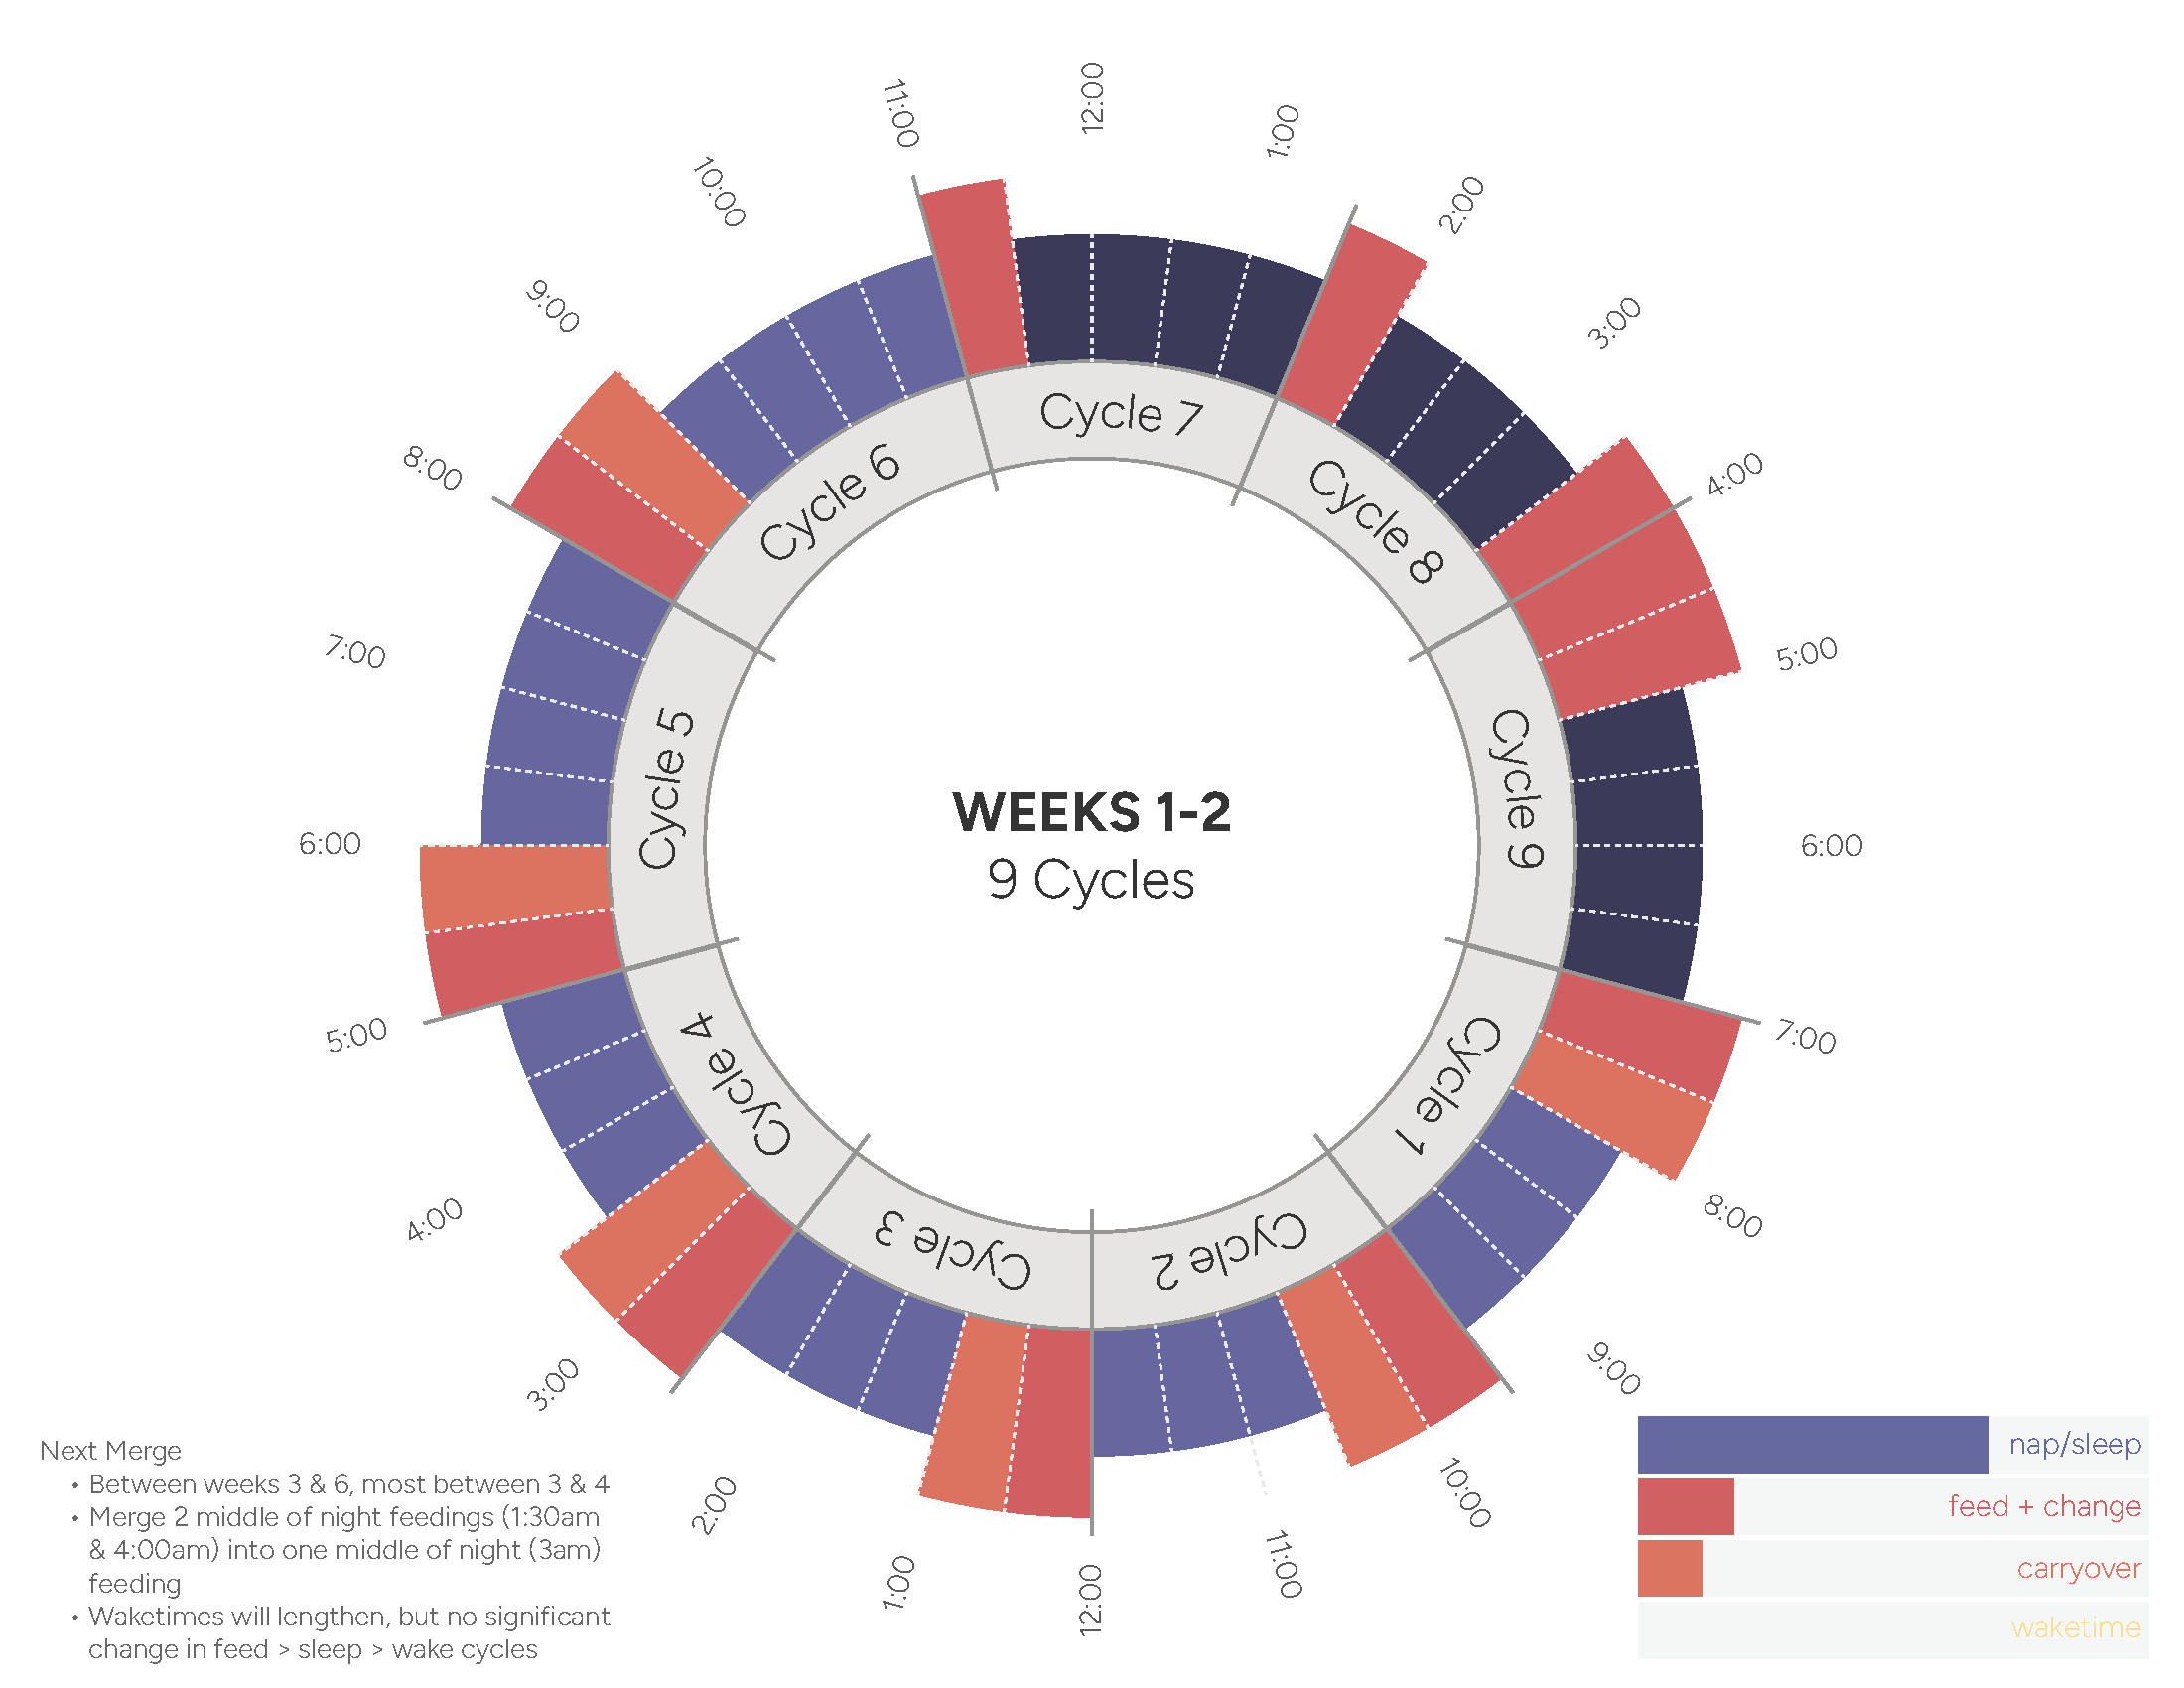
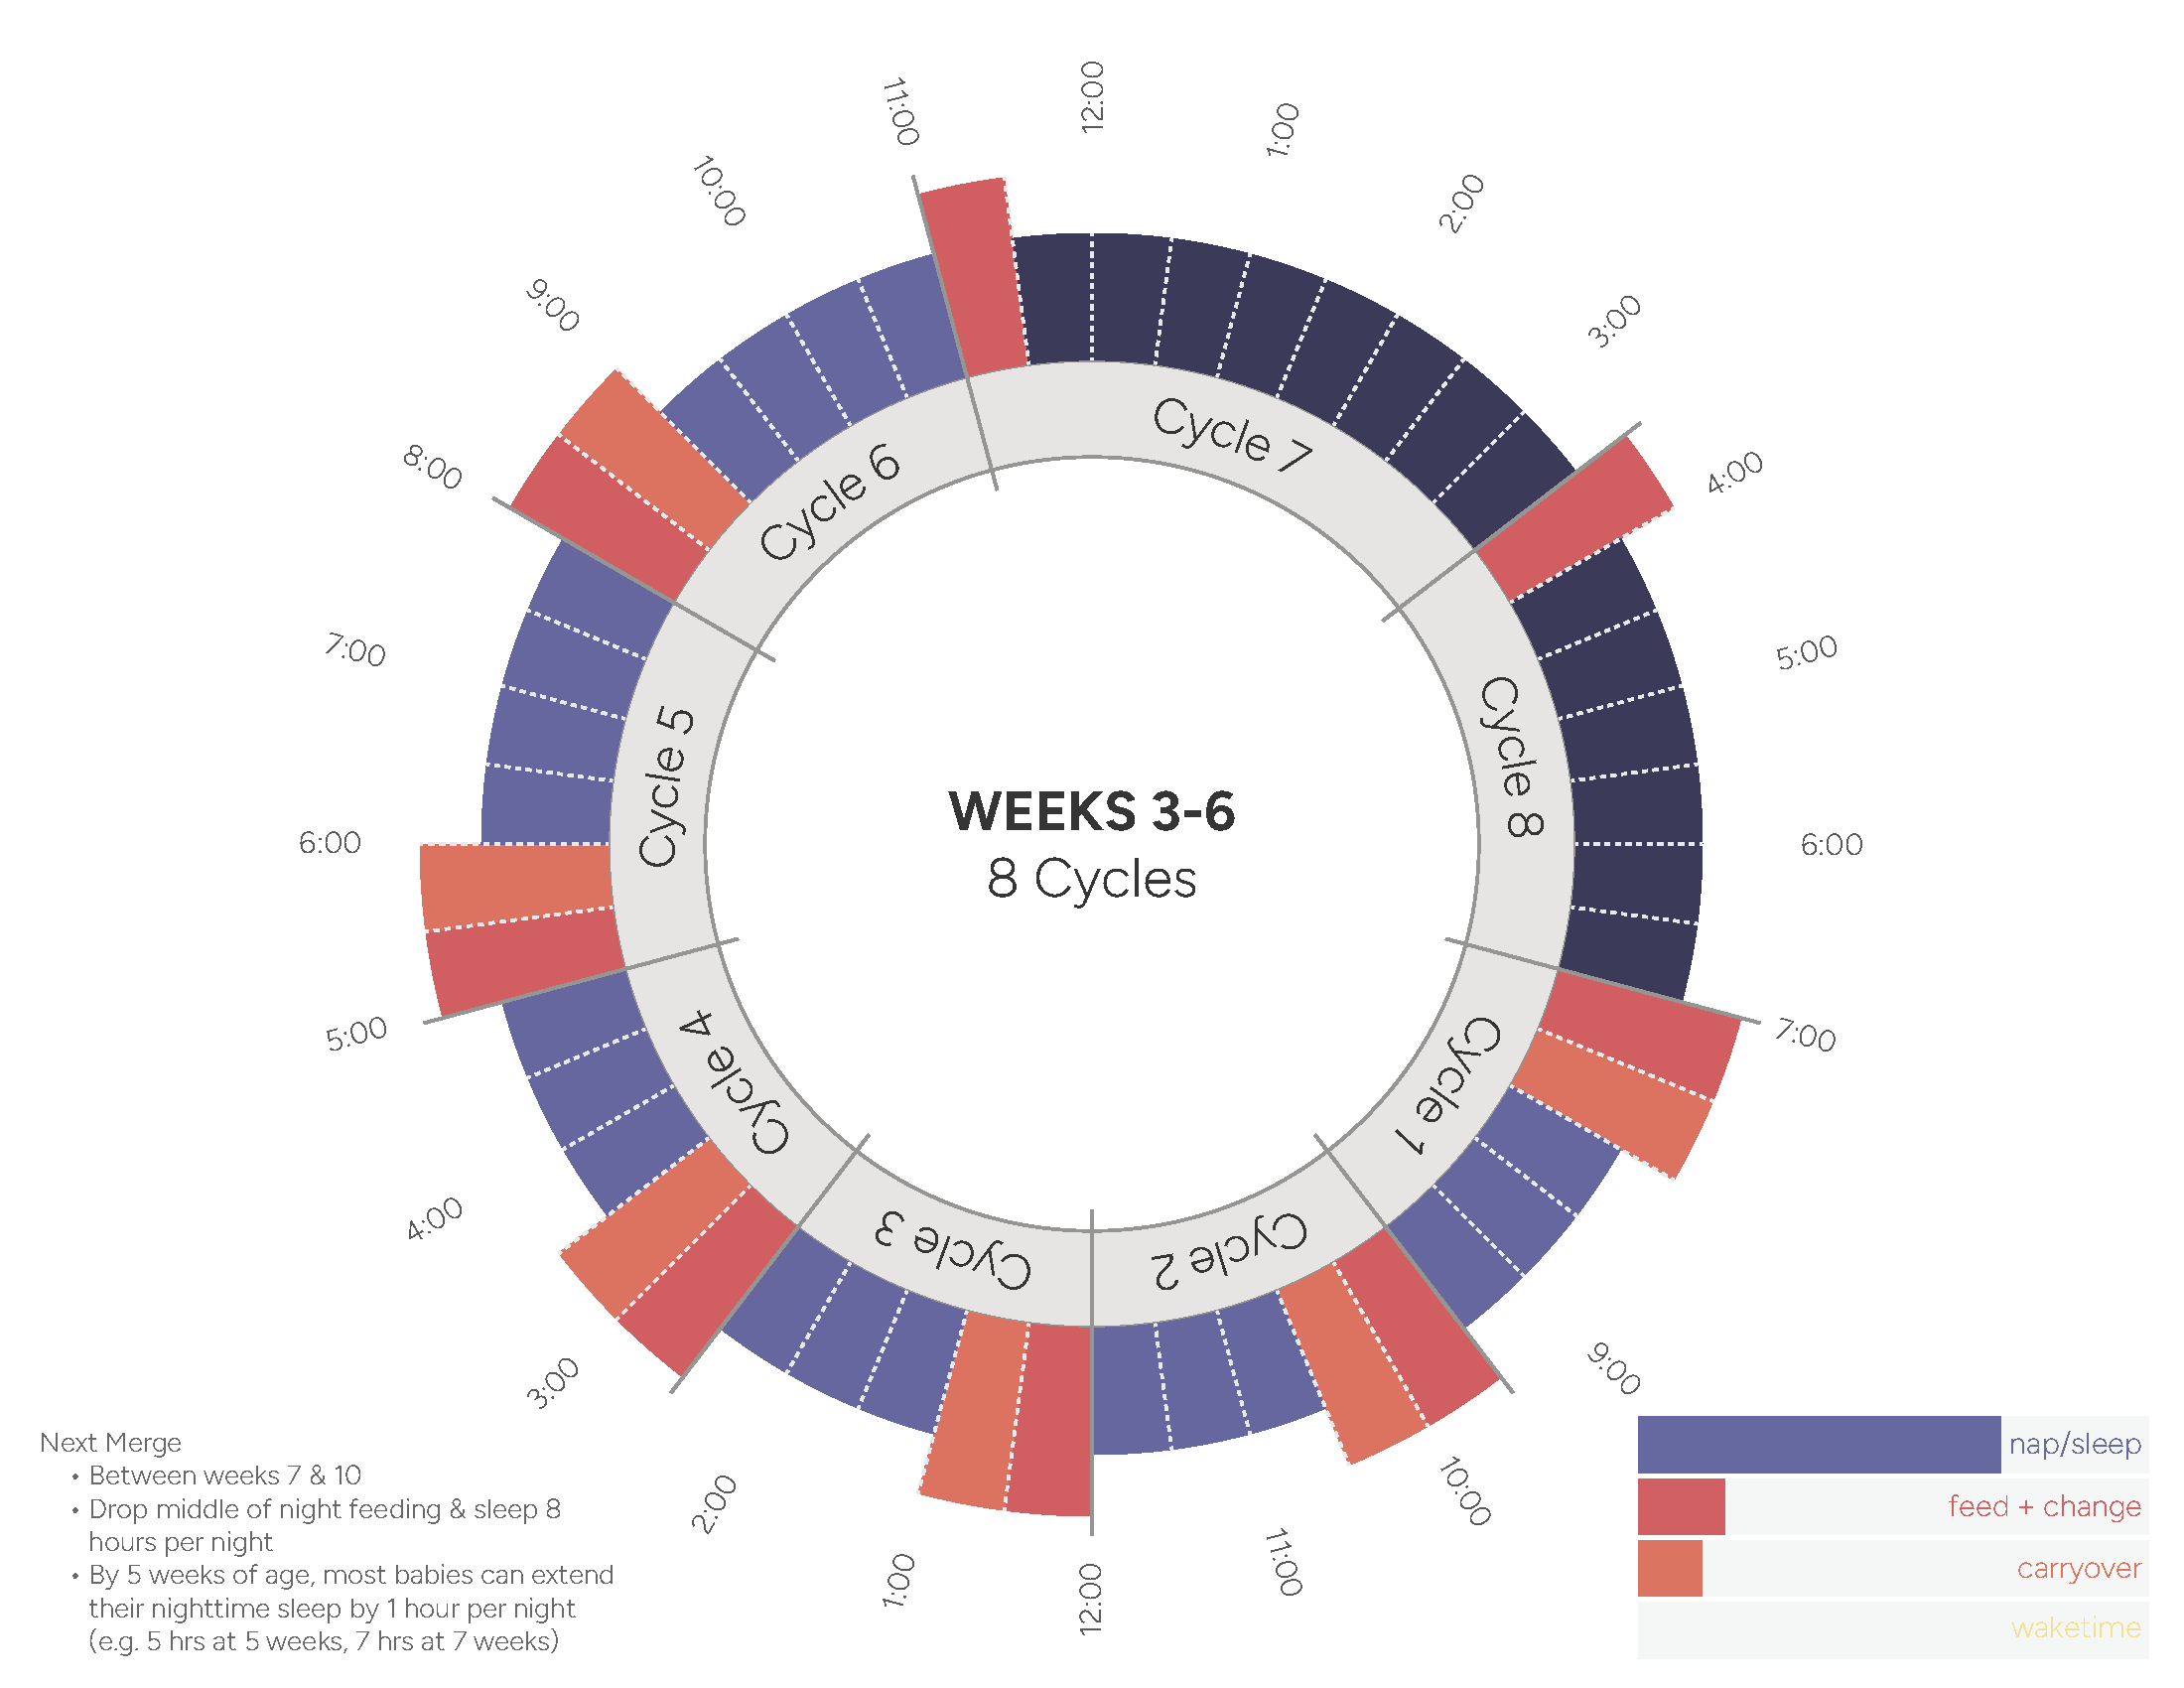
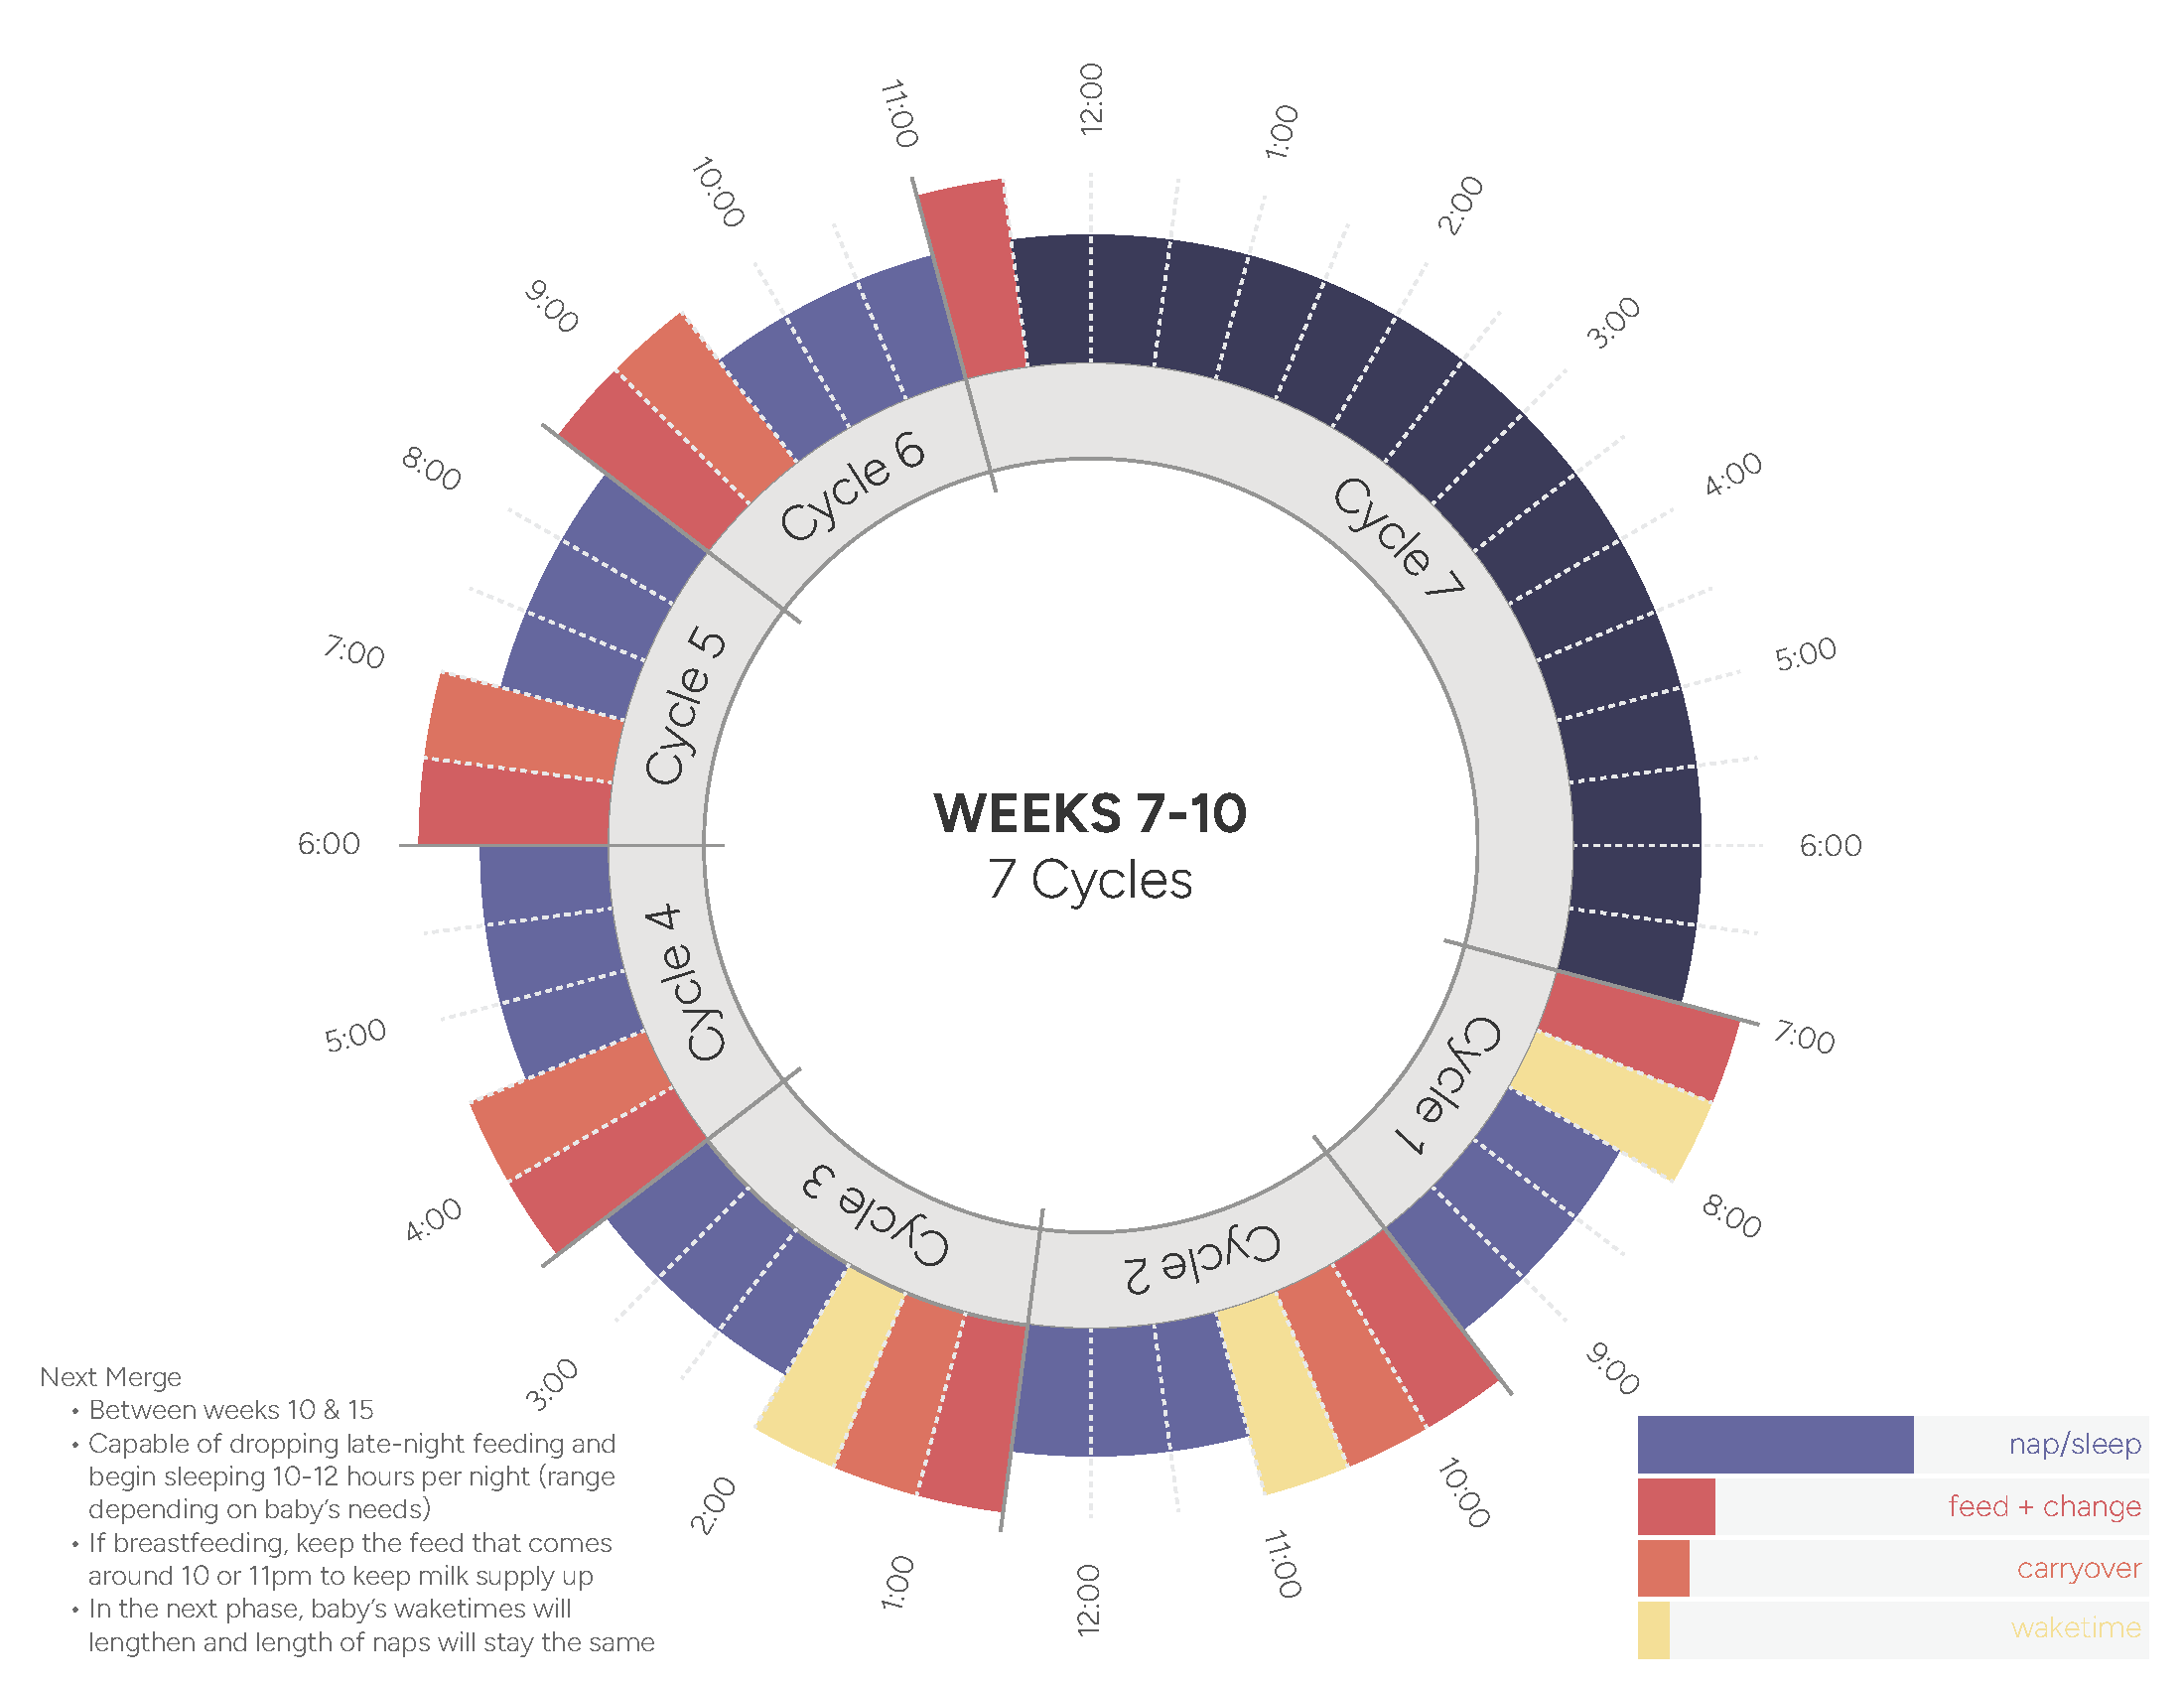
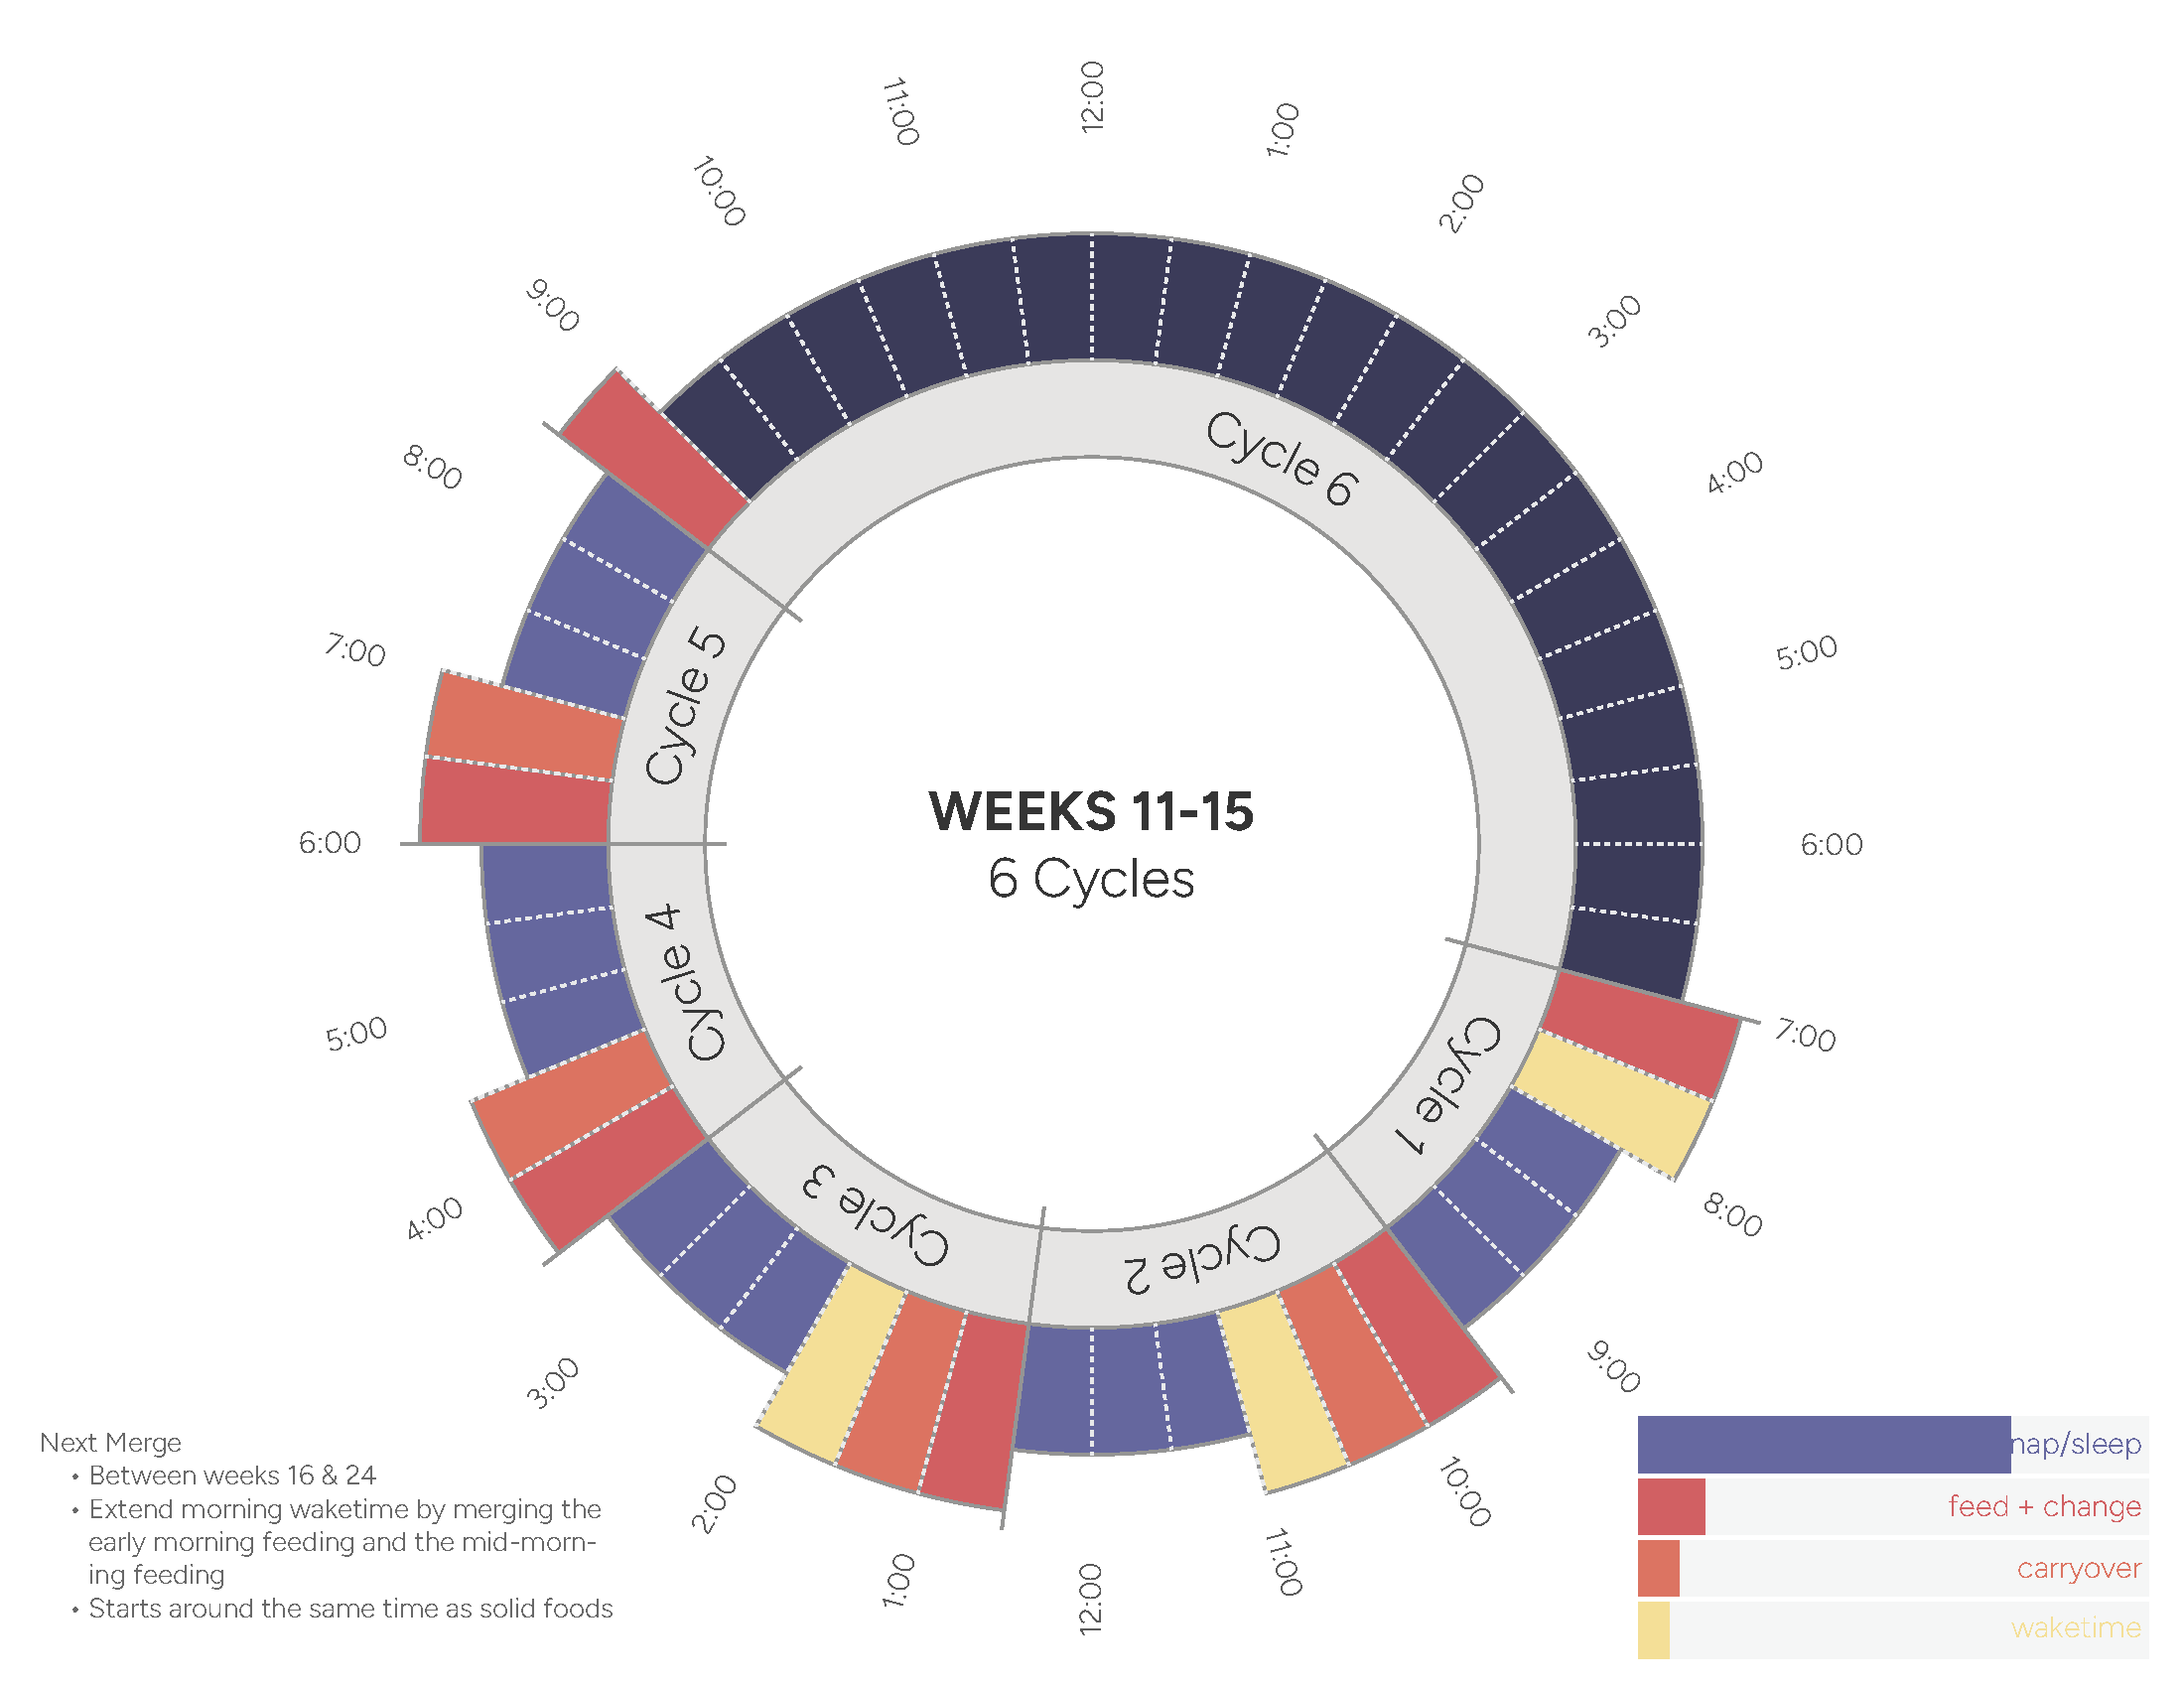
Improve the readability of tabular data, by convering it into a data visualization
Overview
When we had our first kid, my wife and I read a number of books and blogs to figure out what we were doing. For sleep training, we landed on using one that laid out the start of an example table of sleepign schedulesg. The examples laid out a number of templates in grid form and left you to figure out what worked the best for your baby. It was useful, but difficult to interpret and extrapolate the rest of the day, expecially for sleep deprived parents. I transposed the data into Excel, figuring out what a rough day might look like for each training period. From there, I sketched out different ideas of how to visualize the data and then worked in Adobe Illustrator to mock up the structure. At the end, we were able to pin up each period’s schedule onto our fridge and outside the baby’s room.